Performance Monitoring
The Performance Monitoring homepage is the main view where you can search or browse for transaction data. Filter by search conditions or choose from a list of sortable transactions in the table. As soon as a transaction of interest has been rooted out, you can investigate further by clicking it for its summary view.
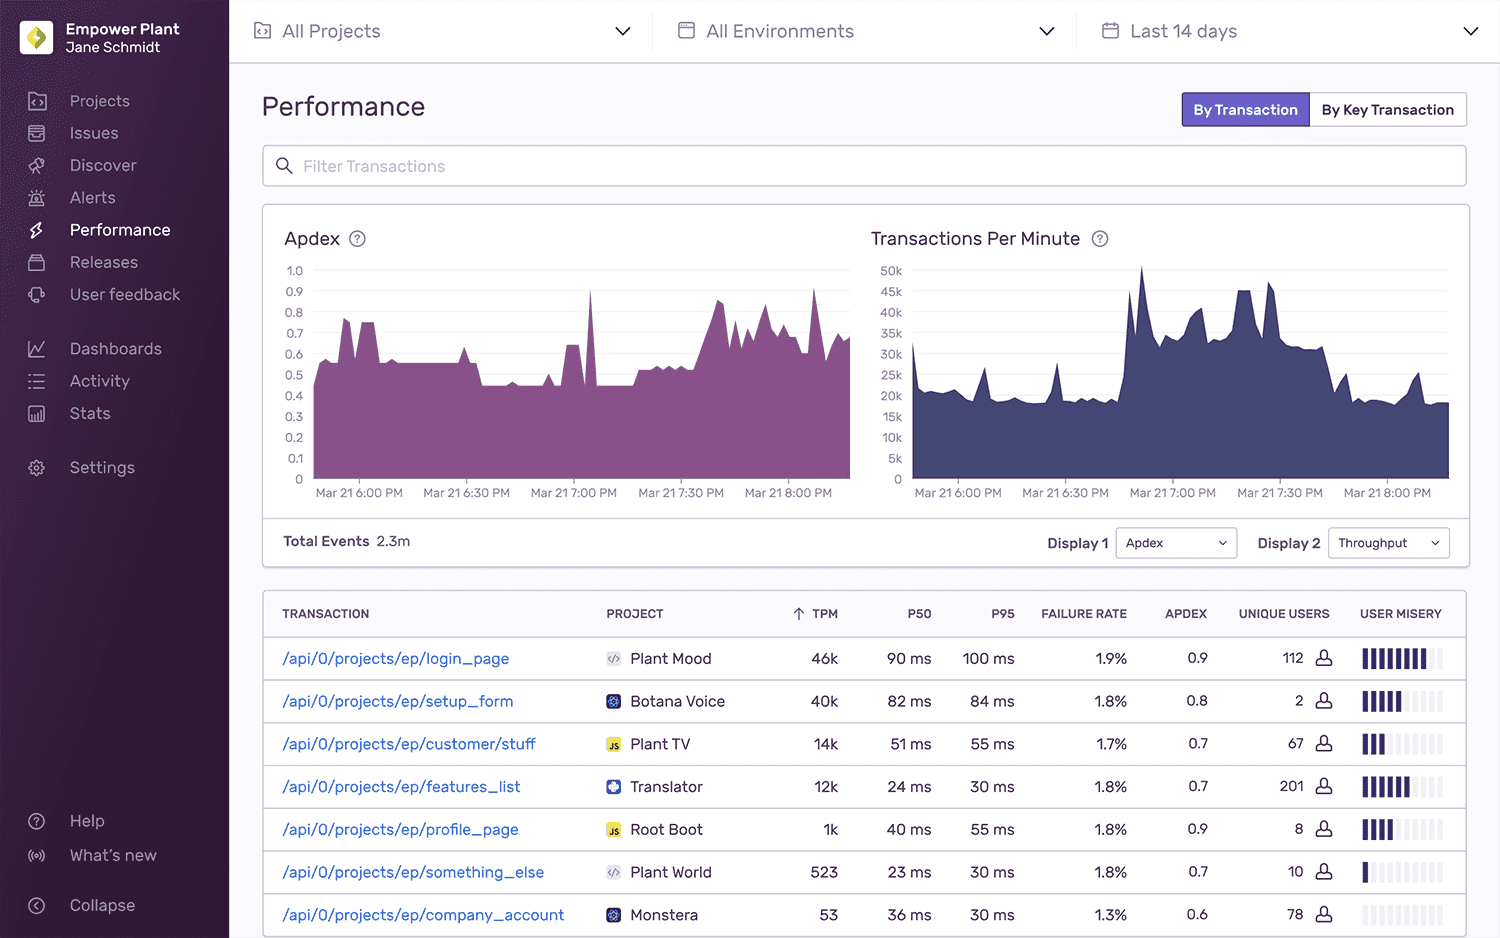
Filter by Search Conditions
The search bar operates similarly to the one in the Discover Query Builder. For example, you can refine your transaction search to a specific release by using release: as a key field and assigning the version as a value.
Graphs
Compare graphs side by side to find any relevant correlations. For example, if an Apdex score dips significantly during a given time period, you'll be able to visualize whether throughput spiked in the same time interval. The global header and search conditions will also enable you to filter these graphs even more. The display options are listed below:
Transaction Table
Below the graphs are a list of transactions that may be filtered down based on global header and search condition filters. The provided columns offer details about each transaction.
- Transaction Name
- Project
- TPM
- P50
- P95
- Failure Rate
- Apdex
- Unique Users
- User Misery
Key Transaction View
If you have transactions you frequently return to; you can mark each one as a key transaction in their corresponding summary views. This enables a shortcut to view only Key Transactions by toggling the tab in the upper right corner of the homepage.